Week in Review
Monday
Acuity tests all day. Boring....
Tuesday
For this unit's final project, my students will work in collaborative teams to make rube goldberg devices. In order to get them pumped up and to give them some ideas we started class this week watching Audri's rube goldberg device (see below).
Every day this week I'll start class with a different video, some from YouTube and others from exemplar student projects from last year. These videos help the students stay focused on the long-term project in the midst of the daily grind and prevent "Why do I have to learn this stuff?" questions from popping out. "Why? Because you're going to make an awesome, ridiculously complicated machine in 2.5 weeks. That's why."
After the video we started practicing how to diagram out energy transformations from several objects around the room. Good times.
Wednesday
We started class with another Rube Goldberg video and then filled out another google doc with creative ideas we could use for our end-of-unit project. I like using GoogleDocs instead of worksheets because students are coming up with the examples instead of myself. I also like having them comment on each other's works because I think it keeps them from entering junk work because they know their peers will be reading it as well as me.
 |
| see whole document here |
Thursday
Today was one of the student's favorite labs of the year - the burning chip lab! We analyzed caloric content of chips by burning cheetos, fritos, and lays chips under cans of water and recording differences in water temperature.
 |
| Guess who was busted on lab safety? |
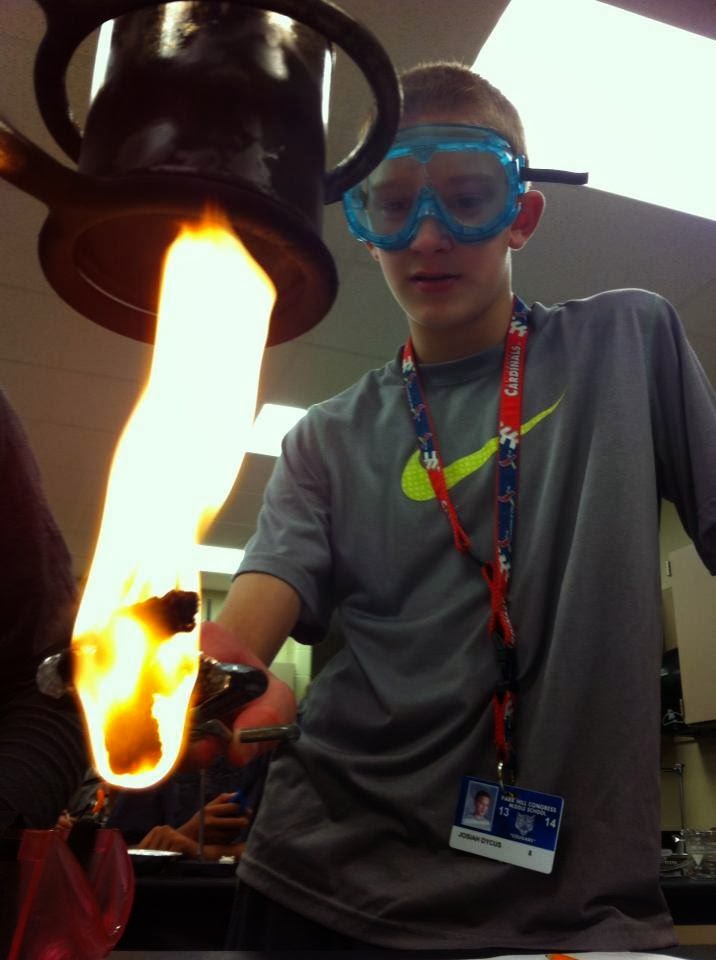 |
| "Oh, I see. That's why they call them flaming hot cheetos." |
Friday
Here's a look at our class data for periods 2 and 3.
When looking at Fritos for period 2 you can see there is quite a range in temperature differences - 8 degrees for one group, 21 for another, and 16 for a third. Same with cheetos in period 3.
Therefore we spent the first half of Friday discussing the following: "Is there a high enough degree of difference between data points that we should simply throw out the data and label it unreliable, or do we need to just label a few data points as outliers and determine the trend." I projected the google doc shown above on the whiteboard and forced the entire class to discuss.
They were really timid at first, but I kept throwing the question back at them and demanded an answer. Students began offering weak responses and I kept (gently) throwing their responses back to them, pointing out inconsistencies with Socratic questioning. Eventually some hard-nosed students started taking the bait and began using some logical reasoning and evidence to back up there responses and we eventually decided to throw out the data as generally unreliable.
It wasn't about a right or wrong answer but it was about using evidence to back up your assertion. I told them this was a real-world, authentic experience and that an untold number of occupations - from finance to education to marketing to scientific research - conducted this sort of data analysis every day.
The rest of the period we spent constructing a list of potential sources of errors. I was proud that my students generated the robust list seen below.
Potential Sources of Error:
- Chip size
- Burn technique - are you letting the flame lick up the chip (good idea!) or letting it smolder at the top (bad idea)]
- Curn distance - are you roasting the can by holding it immediately underneath or are you giving lots of space between can and chip)
- Can temperature - between each trial students put in fresh water, but the can has now been preheated.
- Pyros - did some groups hold the lighter under the can and continue to burn the chip even as it was lit on fire? (Anecdotal evidence suggests yes)
- Thermometer- did students give enough time for the thermometer to accurately read the temperature or did they drop it in, read it quickly, then change the water for the next trial.
- User Error - mismeasurements in regards to amount of water, thermometer reading, etc...
Closing comment one students made - "Ugh, my head hurts Mr. Mabrey. Why did you make us think so much today." Mission accomplished.
Lessons Learned
- Lab data on Google Spreadsheets - I can't imagine not doing this for every lab. I love how students instinctively assess their data against other classes to determine validity. Validity is a concept that is becoming implicit with every lab and is getting to the point I dont' have to explicitly harp on it any more thanks to this tool.
No comments:
Post a Comment